How to Read a Crypto Candlestick Chart: Patterns Every Beginner Should Know
Candlestick charts are the universal language of financial markets. Once you understand what each candle encodes, you can read market psychology at a glance.
The Language of Price Action
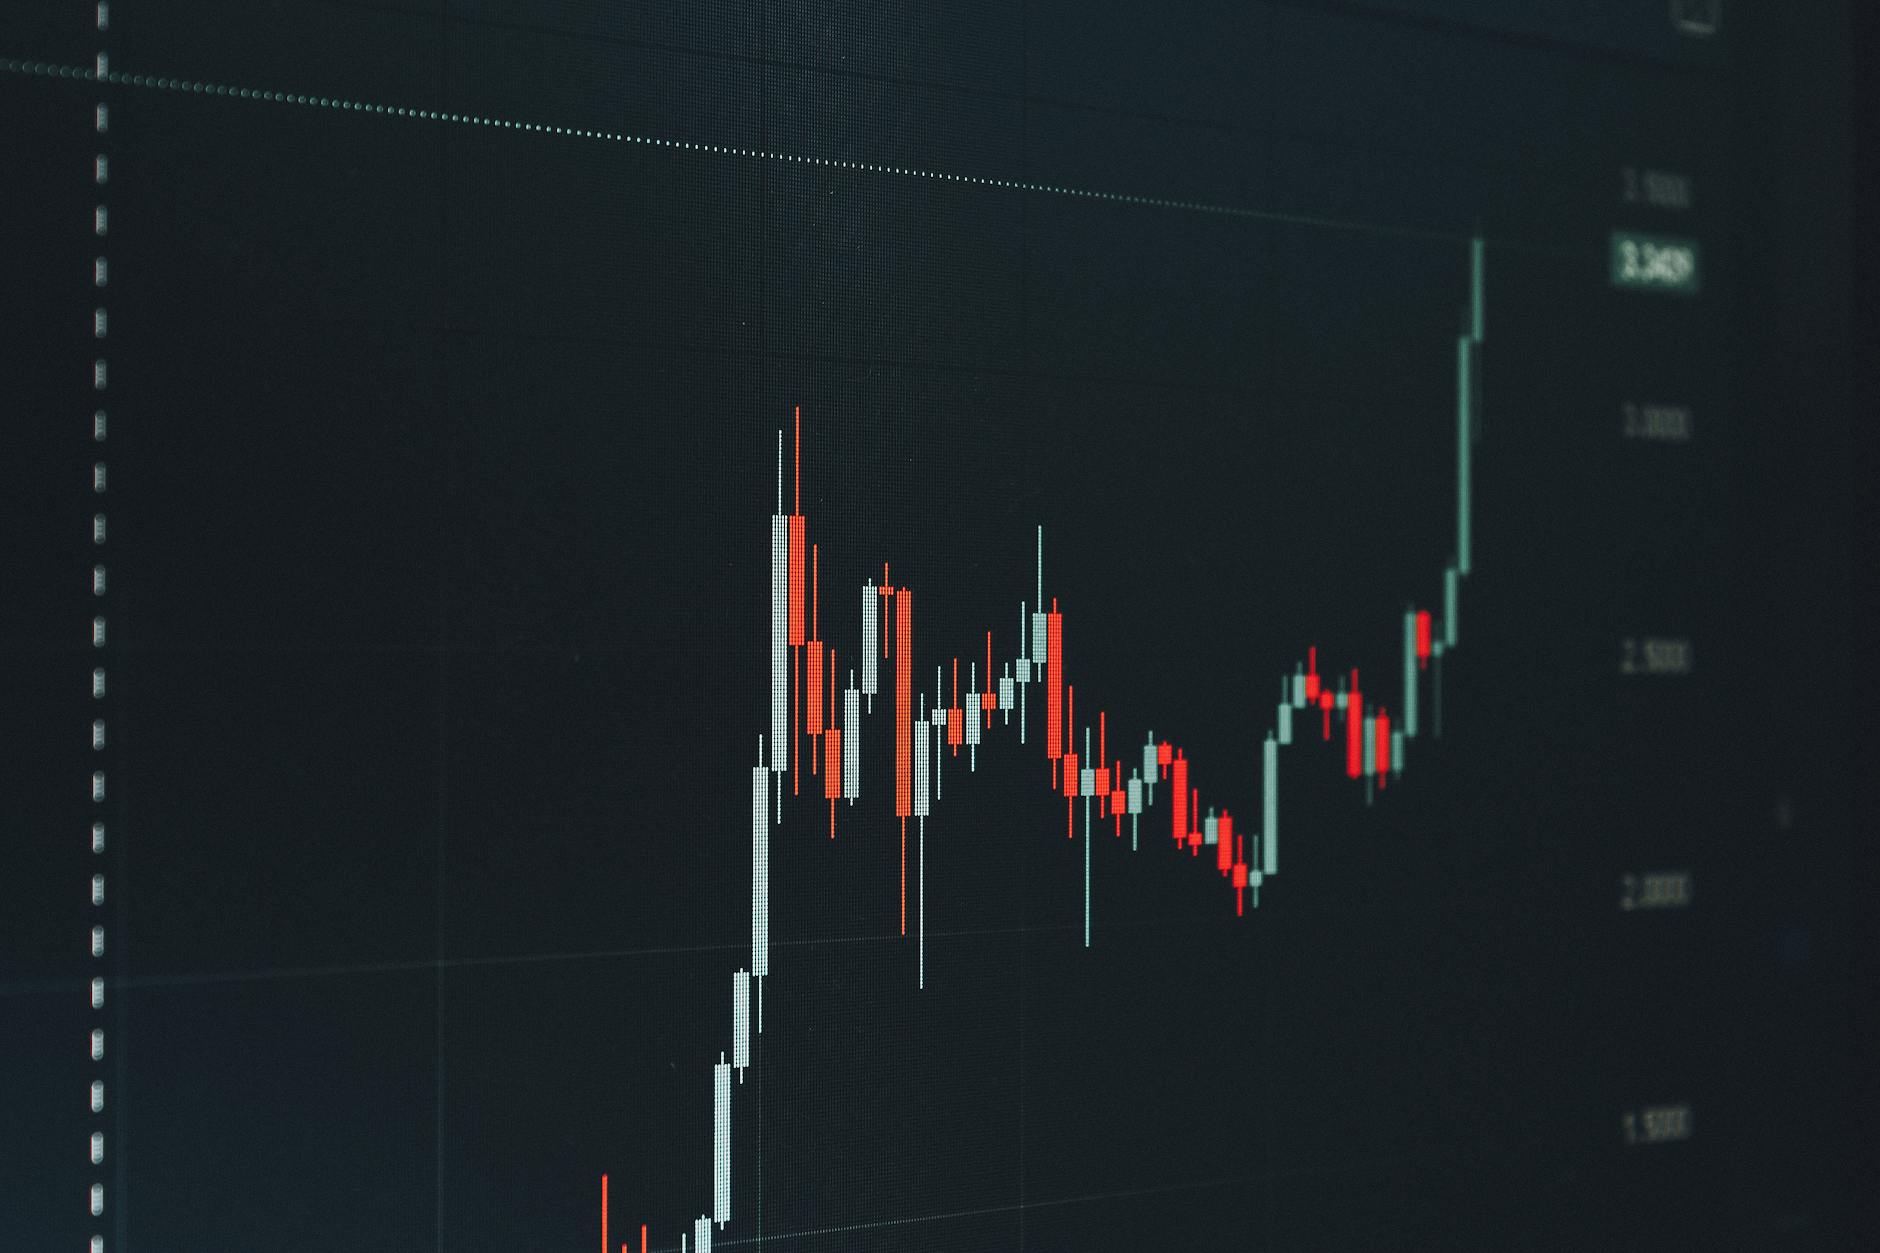
Candlestick charts are the universal visual language of financial markets — a system developed in 18th-century Japanese rice trading and adopted universally by modern technical analysts. Every chart you encounter on DexScreener, TradingView, or any DEX interface uses this format. Once you understand what each candle encodes, you can read market psychology in minutes.
Anatomy of a Single Candle
Each candlestick represents one time period (5 minutes, 1 hour, 1 day — whatever the chart's timeframe setting is) and encodes four prices:
- Open: The price at the start of the period
- Close: The price at the end of the period
- High: The highest price reached during the period
- Low: The lowest price reached during the period
The body of the candle (the thick rectangle) spans from open to close. The thin lines extending above and below the body are called wicks (or shadows) and represent the high and low.
Green candle: Close is higher than open — price rose during this period (buyers in control)
Red candle: Close is lower than open — price fell during this period (sellers in control)
Reading Individual Candle Size and Shape
- Large body, small wicks: Strong directional move. Buyers or sellers were decisively in control with little opposing pressure.
- Small body, large wicks: Indecision. Price moved significantly in both directions but closed near where it opened. Neither side held their gains.
- Long upper wick, small body at bottom: Shooting star or gravestone doji — price tried to rally but sellers pushed it back down. Often a bearish reversal signal at highs.
- Long lower wick, small body at top: Hammer or dragonfly doji — price tried to fall but buyers pushed it back up. Often a bullish reversal signal at lows.
Key Multi-Candle Patterns
Bullish engulfing: A large green candle completely "engulfs" the previous red candle's body. Often signals a reversal from bearish to bullish momentum.
Bearish engulfing: The reverse — a large red candle engulfs the previous green candle. Potential top signal.
Doji star: A candle where open and close are nearly identical (very small or no body). Signals indecision — the market is undecided. Most significant when it appears after a strong trend.
Three white soldiers / three black crows: Three consecutive large green (or red) candles with ascending (or descending) closes. Strong trend continuation signal.
What Candlestick Patterns Can and Cannot Tell You
Candlestick patterns represent statistical associations, not certainties. A bullish engulfing on a Solana meme coin chart does not guarantee the next move is up — it indicates that the market psychology at that moment showed buyers overwhelming sellers, which has historically been followed by continuation more often than reversal. The signal has value proportional to the timeframe (daily patterns are more reliable than 1-minute patterns) and the volume accompanying the pattern.
Use candlestick patterns as one input among several, never as a standalone trading signal. The most useful habit is simply learning to read charts quickly — identifying trend direction, support/resistance zones, and the strength of recent moves — without over-relying on specific pattern names.
Ready to apply this to a real token?
Run any Solana mint address through Hannisol's 8-dimension risk engine — free, no signup required.